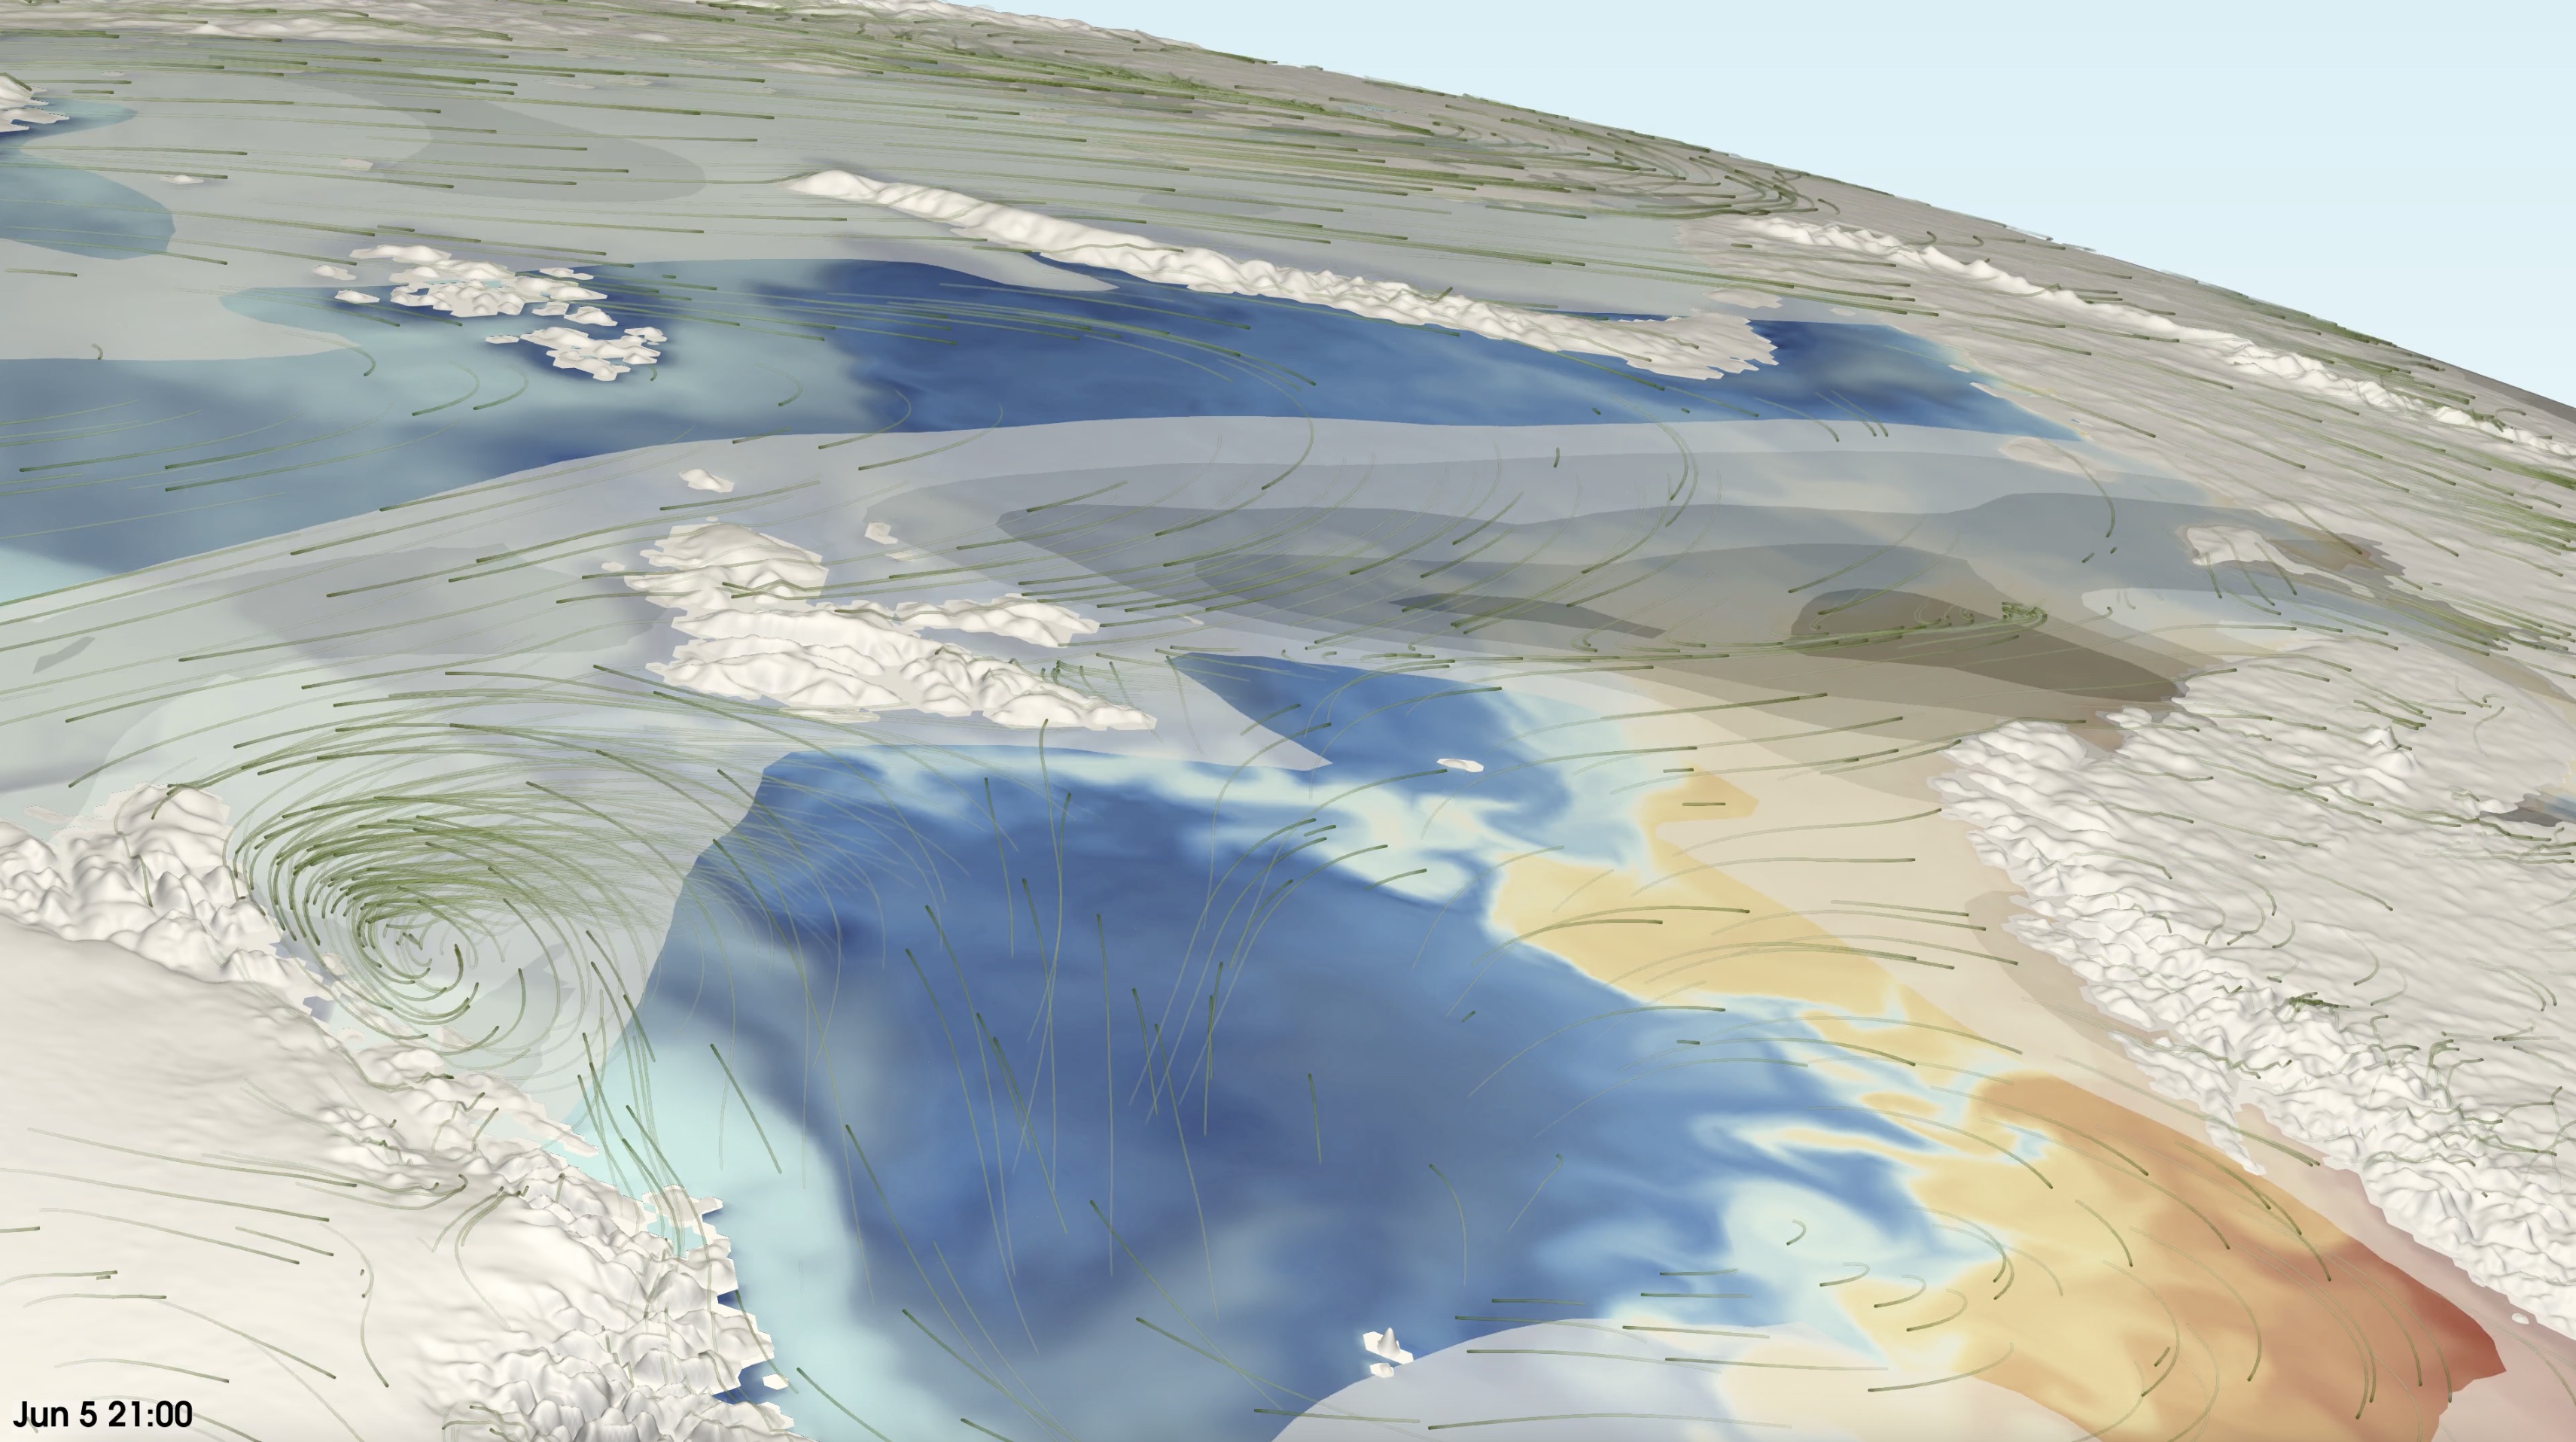
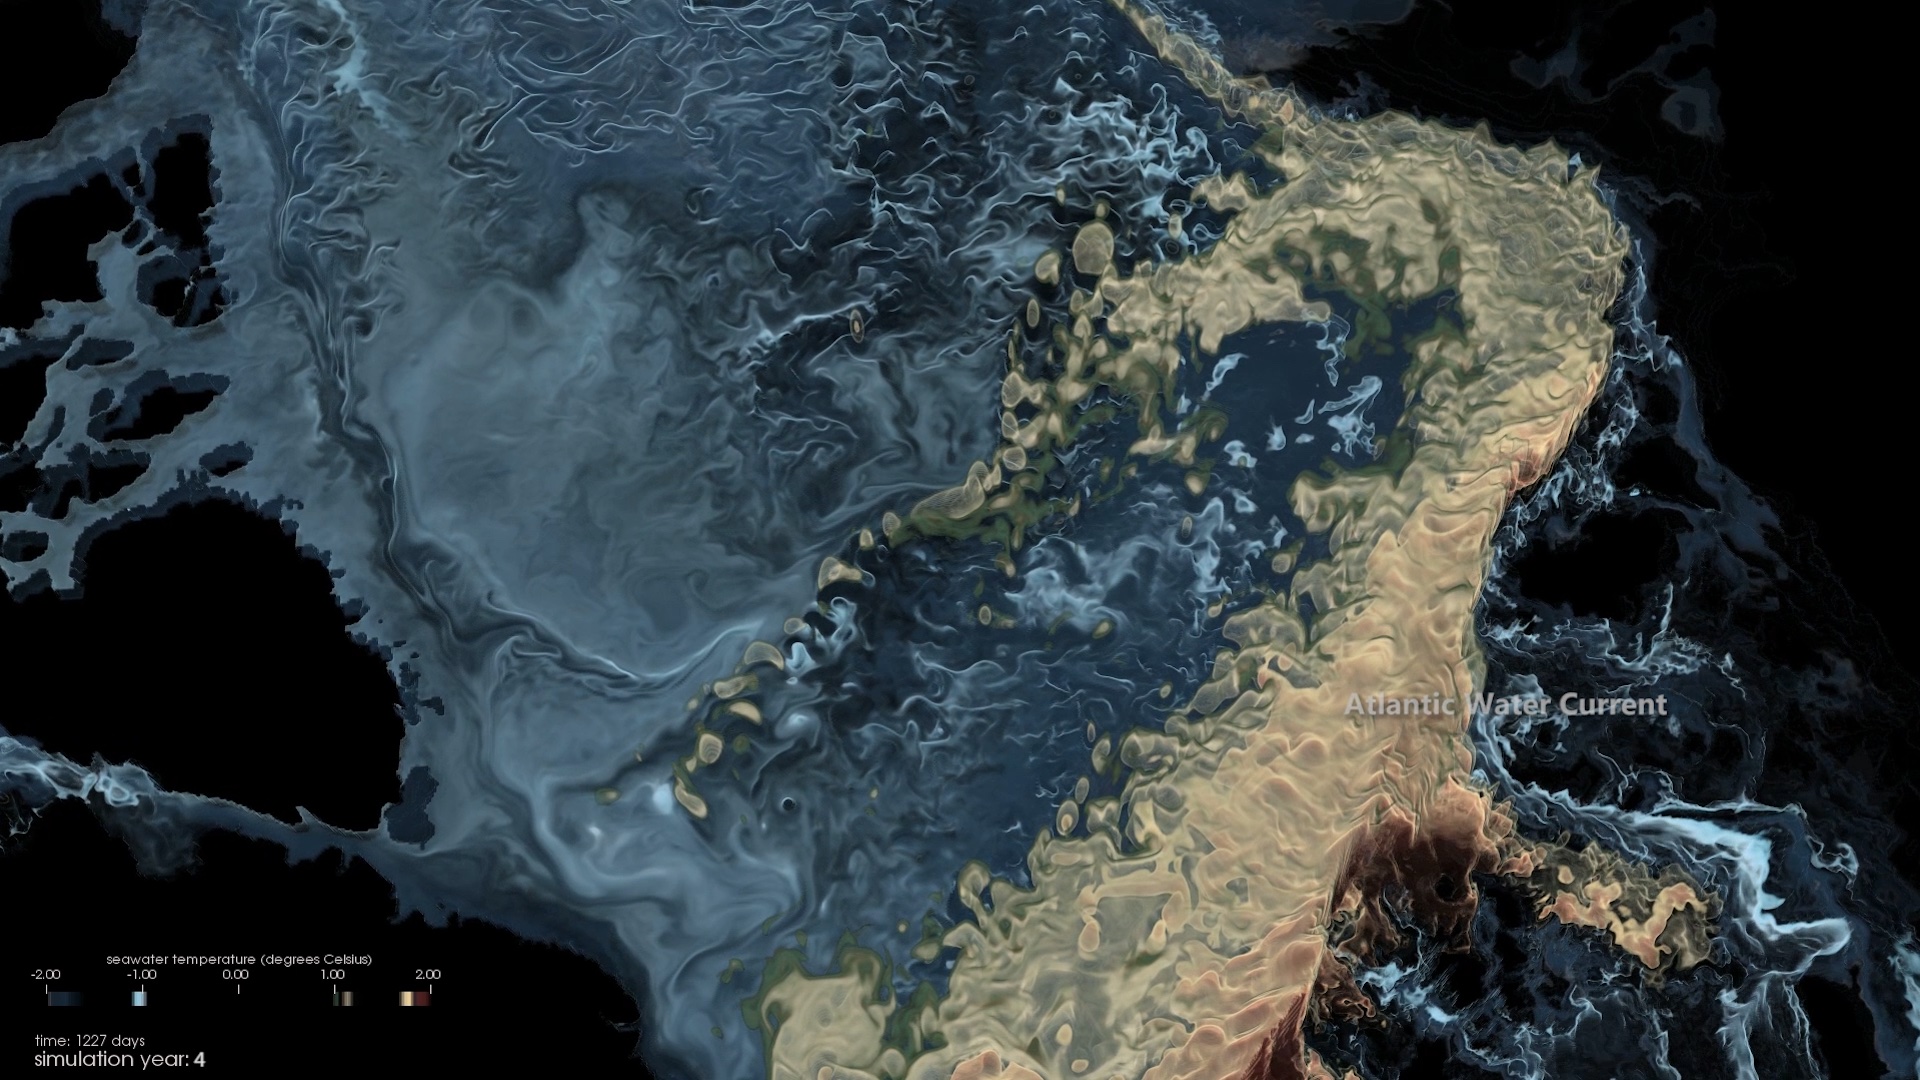
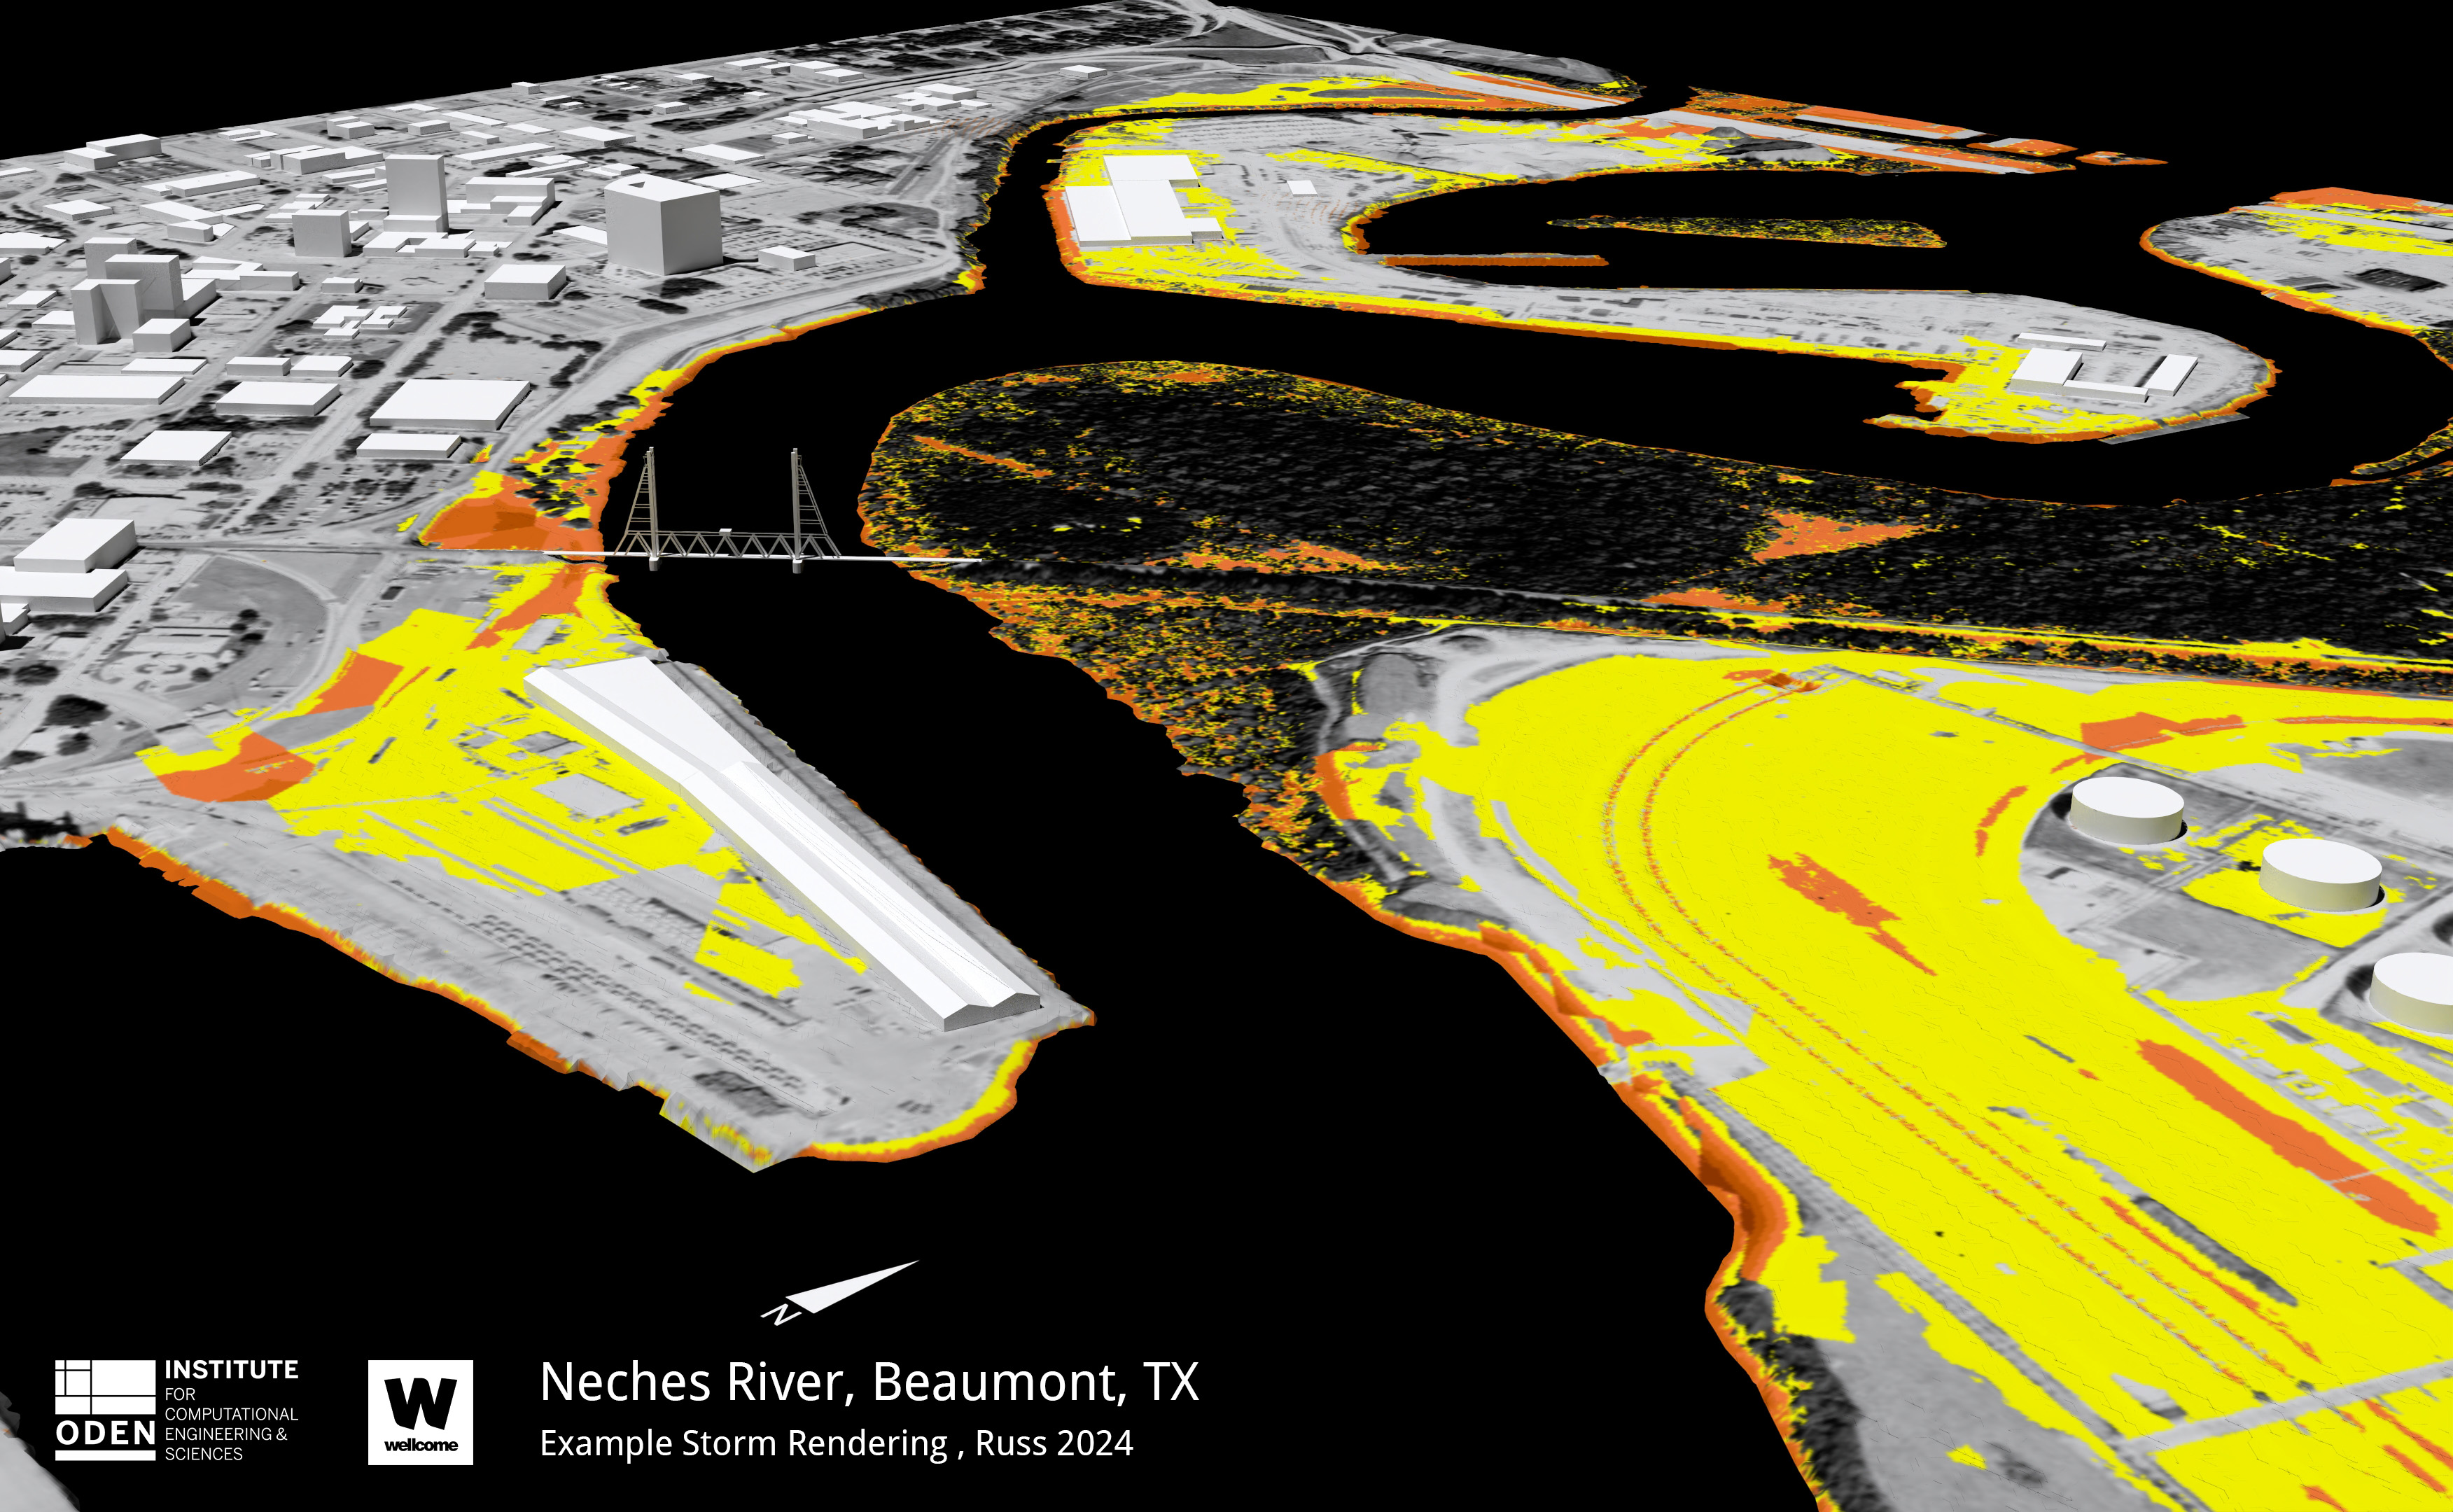
The human brain processes images in just 13 milliseconds—60,000 times faster than comprehension of the written word. From Leonardo da Vinci’s Mona Lisa to universal symbols, images transcend barriers and bring connection and understanding.
For scientists, visualization provides a window into data representing physical systems that cannot be directly seen to help guide and inform decision-making of complex systems like climate modeling, medicine, and engineering.
“Scientific visualization enables scientists the ability to explore their data, compare categories of information and help parse and understand the huge data sets that are a result of computational modeling,“ said Francesca Samsel, a research scientist specializing in visualization with the Texas Advanced Computing Center (TACC) at UT Austin. "One of the best questions a visualization expert can ask a scientist is: In your wildest dreams, what do you want to see in the data that is not visible now?"
“For more than two decades, our visualization experts have collaborated with scientists and translated their data into images, animations, and virtual worlds to communicate complex problems,” said TACC Deputy Director Kelly Gaither. In 2022, Gaither resumed the position as the Director of Visualization, a role she held from 2001-2017.
While most data analysis software programs create visual images of data, researchers often need a more in-depth representation requiring specialized software and computing power using detailed nuances in color, contrast, and shapes to provide a multi-dimensional analysis of research.


